来源
笔记来源:PixiJs学前篇(一):Canvas基础【绘制篇】🔥🔥面对网页性能要求越来越高的今天,项目性能优化已经成了项目开发 - 掘金 (juejin.cn)
介绍
Canvas是HTML5中的一个非常重要的元素,它允许通过JavaScript在网页上直接绘制图形和动画。Canvas提供了一个可以通过像素处理图像的空白画布,开发者可以在上面绘制各种图形、文本以及实现复杂动画效果。
主要用途:
- 绘图:可以用来绘制线条、矩形、圆形、弧线等基本形状,也可以加载并操作图像。
- 游戏开发:由于其高效的绘图能力,Canvas常被用于开发2D游戏。
- 数据可视化:通过绘制图表、仪表盘等来展示数据信息。
- 动画制作:支持创建流畅的动画效果,适用于交互式应用或网站。
使用方法:
开始使用Canvas,首先需要在HTML中添加<canvas>标签,并为其指定宽度和高度。例如:
1
| <canvas id="myCanvas" width="500" height="400"></canvas>
|
然后,通过JavaScript获取Canvas上下文对象(通常是2D绘图环境),就可以在Canvas上进行绘图了:
1
2
3
4
5
6
| var canvas = document.getElementById('myCanvas');
var ctx = canvas.getContext('2d');
ctx.fillStyle = 'green';
ctx.fillRect(10, 10, 150, 100);
|
Canvas的强大之处在于它的灵活性和高性能,使开发者能够创造出丰富多样的视觉效果。不过,需要注意的是,Canvas只支持光栅图形(即位图),不支持矢量图形。对于复杂的图形和动画,可能需要考虑结合其他技术如SVG一起使用。
上下文
canvas.getContext(contextType, contextAttributes)
描边和填充
样式设置
strokeStyle
描边的样式
fillStyle
填充的样式
直线
直线的绘制就是设置两个点,然后连接这两个点形成一条直线,那么这两个点如何设置呢?
moveTo(x, y)
设置初始位置,参数为初始位置x和y的坐标点
lineTo(x, y)
设置指定位置,参数为指定位置x和y的坐标点
直线的样式可以通过一系列属性来设置,
lineWidth
lineCap
设置直线端点显示的样式。可选值为:butt,round 和 square。默认是 butt。
lineJoin
设置两线段连接处所显示的样子。可选值为:round, bevel 和 miter。默认是 miter。
miterLimit
设置当两条线相交时交接处最大长度;所谓交接处长度(斜接长度)是指线条交接处内角顶点到外角顶点的长度。
线段之间夹角比较大时,交点不会太远,但随着夹角变小,交点距离会呈指数级增大。
如果交点距离大于miterLimit值,连接效果会变成了 lineJoin = bevel 的效果。
三角形
1
2
3
4
5
6
7
8
9
10
11
12
13
14
15
16
17
| const canvas = document.getElementById('canvas');
const ctx = canvas.getContext('2d');
ctx.strokeStyle = "#f00"
ctx.fillStyle = "#00f"
ctx.lineWidth = 5
ctx.moveTo(50, 100)
ctx.lineTo(50, 400)
ctx.lineTo(400, 400)
ctx.lineTo(50, 100)
ctx.stroke();
ctx.beginPath()
ctx.movTo(200, 200)
ctx.lineTo(400, 200)
ctx.lineTo(400, 370)
ctx.fill();
|
矩形
// 矩形描边
rect(x, y, width, height)
// 绘制矩形
strokeRect(x, y, width, height)
// 填充矩形
fillRect(x, y, width, height)
上述的三个方法都可以用来绘制矩形,他们的传参都是一样的,其中x和y是起始点的x坐标和y坐标,width为矩形的宽,height为矩形的高。
1
2
3
4
5
6
7
8
9
10
11
12
13
14
| const canvas = document.getElementById('canvas');
const ctx = canvas.getContext('2d');
ctx.strokeStyle = "#f00"
ctx.fillStyle = "#00f"
ctx.lineWidth = 5
ctx.rect(50, 50, 300, 100)
ctx.fill()
ctx.beginPath()
ctx.fillRect(50, 300, 300, 100)
|
圆形
ctx.arc(x, y, radius, startAngle, endAngle, anticlockwise);
x,y 为圆弧中心或圆的圆心坐标、
radius 为圆弧的半径或圆的半径、
startAngle 为圆弧或圆的起始点,从x轴方向开始计算,且单位为弧度、
endAngle 为圆弧或圆的终点,单位也是为弧度
anticlockwise 是一个可选参数,可选值为Boolean类型,用它来表示圆弧或圆的绘制方向,默认为false,顺时针绘制圆弧或圆。
角度转弧度的公式为:弧度 = 角度 * Math.PI / 180
1
2
3
4
5
6
7
8
9
10
11
12
13
14
15
|
const canvas = document.getElementById('canvas');
const ctx = canvas.getContext('2d');
ctx.strokeStyle = "#f00"
ctx.fillStyle = "#00f"
ctx.lineWidth = 5,
ctx.arc(100, 100, 50, 0, 90 * Math.PI /180 );
ctx.stroke();
ctx.beginPath();
ctx.arc(300, 100, 50, 0, 90 * Math.PI /180, true );
ctx.stroke();
|
椭圆
1
| ellipse(x, y, radiusX, radiusY, rotation, startAngle, endAngle, anticlockwise)
|
- x、y:椭圆的圆心坐标
- radiusX:x轴的半径大小
- radiusY:y轴的半径大小
- rotation:椭圆的旋转角度,也是以弧度表示
- startAngle:开始绘制点
- endAngle:结束绘制点
- anticlockwise:可选参数,表示绘制的方向(默认顺时针)。
1
2
3
4
5
6
7
8
9
10
11
12
13
14
15
16
|
var canvas = document.getElementById('canvas');
if(canvas.getContext) {
var ctx = canvas.getContext('2d');
ctx.beginPath();
ctx.ellipse(100, 150, 50, 100, 0, 0, 2 * Math.PI);
ctx.stroke();
ctx.beginPath();
ctx.ellipse(400, 150, 50, 100, 0, 0, 2 * Math.PI);
ctx.stroke();
ctx.beginPath();
ctx.ellipse(250, 350, 50, 100, Math.PI/2, 0, 2 * Math.PI);
ctx.fill();
}
|
贝塞尔曲线
二次贝塞尔曲线
如图就是一个二次贝塞尔曲线,他的绘制需要一个控制点来控制曲线,具体的语法为:
1
| quadraticCurveTo(cp1x, cp1y, x, y)
|
参数:
- cp1x和cp1y为控制点坐标
- x和y为结束点坐标
1
2
3
4
5
6
7
8
9
10
11
12
13
14
| id="canvas"
width="500"
height="500"
style="box-shadow: 0px 0px 5px #ccc; border-radius: 8px;">
当前浏览器不支持canvas元素,请升级或更换浏览器!
</canvas>
<script>
const canvas = document.getElementById('canvas');
const ctx = canvas.getContext('2d');
ctx.strokeStyle = "#333";
ctx.beginPath();
ctx.moveTo(100, 250);
ctx.quadraticCurveTo(250, 100, 400, 250);
ctx.stroke();
|
三次贝塞尔曲线
三次贝塞尔曲线和二次贝塞尔曲线不同的是三次贝塞尔曲线有两个控制点。具体的语法为:
1
| ctx.bezierCurveTo(cp1x,cp1y, cp2x,cp2y, x, y)
|
参数为:
- cp1x和cp1y为第一个控制点坐标
- cp2x和cp2y为第二个控制点坐标
- x和y为结束点坐标
1
2
3
4
5
6
7
8
| const canvas = document.getElementById('canvas');
const ctx = canvas.getContext('2d');
ctx.lineWidth = 6;
ctx.strokeStyle = "#333";
ctx.beginPath();
ctx.moveTo(100, 250);
ctx.bezierCurveTo(150, 100, 350, 100, 400, 250);
ctx.stroke();
|
渐变
线性渐变
1
| createLinearGradient(x1, y1, x2, y2)
|
- x1, y1为起点的坐标
- x2, y2为终点的坐标
在渐变的设置中还需要一个方法来添加渐变的颜色,语法为:gradient.addColorStop(offset, color),其中color就是颜色,offset 则是颜色的偏移值,只为0到1之间的数。
1
2
3
4
5
6
7
8
9
10
11
12
13
14
15
16
17
18
19
20
| const canvas = document.getElementById('canvas');
const ctx = canvas.getContext('2d');
ctx.strokeStyle = "#f00"
ctx.fillStyle = "#00f"
ctx.lineWidth = 5
var gradient1 = ctx.createLinearGradient(10, 10, 400, 10);
gradient1.addColorStop(0, "#000000");
gradient1.addColorStop(1, "#ffffff");
var gradient2 = ctx.createLinearGradient(10, 10, 400, 10);
gradient2.addColorStop(0.5, "#000000");
gradient2.addColorStop(1, "#ffffff");
ctx.beginPath()
ctx.fillStyle = gradient1;
ctx.fillRect(10, 10, 400, 100);
ctx.beginPath();
ctx.fillStyle = gradient2;
ctx.fillRect(10, 150, 400, 100);
|
径向渐变
径向渐变是从起点到终点颜色从内到外进行圆形的渐变
语法
1
| ctx.createRadialGradient(x0, y0, r0, x1, y1, r1)
|
参数:
- x0, y0为开始圆的坐标
- r0为开始圆的半径
- x1, y1为结束圆的坐标
- r1为结束圆的半径
1
2
3
4
5
6
7
8
9
10
11
12
13
14
15
16
17
18
19
20
21
22
23
24
25
26
27
28
29
30
31
32
33
34
35
| const canvas = document.getElementById('canvas');
const ctx = canvas.getContext('2d');
ctx.strokeStyle = "#f00"
ctx.fillStyle = "#00f"
ctx.lineWidth = 5
var gradient1 = ctx.createRadialGradient(100, 100, 100, 100, 100, 0);
gradient1.addColorStop(0, "#000000");
gradient1.addColorStop(1, "#ffffff");
var gradient2 = ctx.createRadialGradient(320, 100, 100, 320, 100, 30);
gradient2.addColorStop(0, "#000000");
gradient2.addColorStop(1, "#ffffff");
var gradient3 = ctx.createRadialGradient(100, 320, 100, 100, 320, 0);
gradient3.addColorStop(0.5, "#000000");
gradient3.addColorStop(1, "#ffffff");
var gradient4 = ctx.createRadialGradient(320, 320, 100, 250, 250, 0);
gradient4.addColorStop(0, "#000000");
gradient4.addColorStop(1, "#ffffff");
ctx.beginPath();
ctx.fillStyle = gradient1;
ctx.fillRect(10, 10, 200, 200);
ctx.beginPath();
ctx.fillStyle = gradient2;
ctx.fillRect(220, 10, 200, 200);
ctx.beginPath();
ctx.fillStyle = gradient3;
ctx.fillRect(10, 220, 200, 200);
ctx.beginPath();
ctx.fillStyle = gradient4;
ctx.fillRect(220, 220, 200, 200);
|
图案样式
createPattern(image, type) 参数为:
- Image 参数可以是一个 Image 对象,也可以是一个 canvas 对象
- Type 为图案绘制的类型,可用的类型分别有:repeat,repeat-x,repeat-y 和 no-repeat。
1
2
3
4
5
6
7
8
9
10
11
12
13
14
15
16
17
|
var canvas = document.getElementById('canvas');
if(canvas.getContext) {
var ctx = canvas.getContext('2d');
var img = new Image();
img.src = "./image.png";
img.onload = function() {
var ptrn = ctx.createPattern(img, 'no-repeat');
ctx.fillStyle = ptrn;
ctx.fillRect(0, 0, 500, 500);
}
}
|
文本
轮廓绘制和填充绘制
strokeText()方法是以描边的方式绘制文字的
语法:
1
| ctx.strokeText(txt, x, y, maxWidth)
|
参数:
- txt:是绘制的文本内容
- x、y:为绘制文本的起始位置坐标
- maxWidth:可选参数,为文本绘制的最大宽度。
1
2
3
4
5
6
7
8
9
10
11
12
| const canvas = document.getElementById('canvas');
const ctx = canvas.getContext('2d');
ctx.font = "30px Arial";
ctx.strokeText("携手创作,共同成长,你好,掘金。", 50, 50);
ctx.strokeText("携手创作,共同成长,你好,掘金。", 50, 100, 350);
ctx.fillText("携手创作,共同成长,你好,掘金。", 50, 150, 350);
|
fillText()方法是以填充的方式绘制文字的
语法:
1
| ctx.fillText(txt, x, y, maxWidth)
|
参数:
- txt:是绘制的文本内容
- x、y:为绘制文本的起始位置坐标
- maxWidth:可选参数,为文本绘制的最大宽度。
文本样式
ctx.font = “20px Arial”;
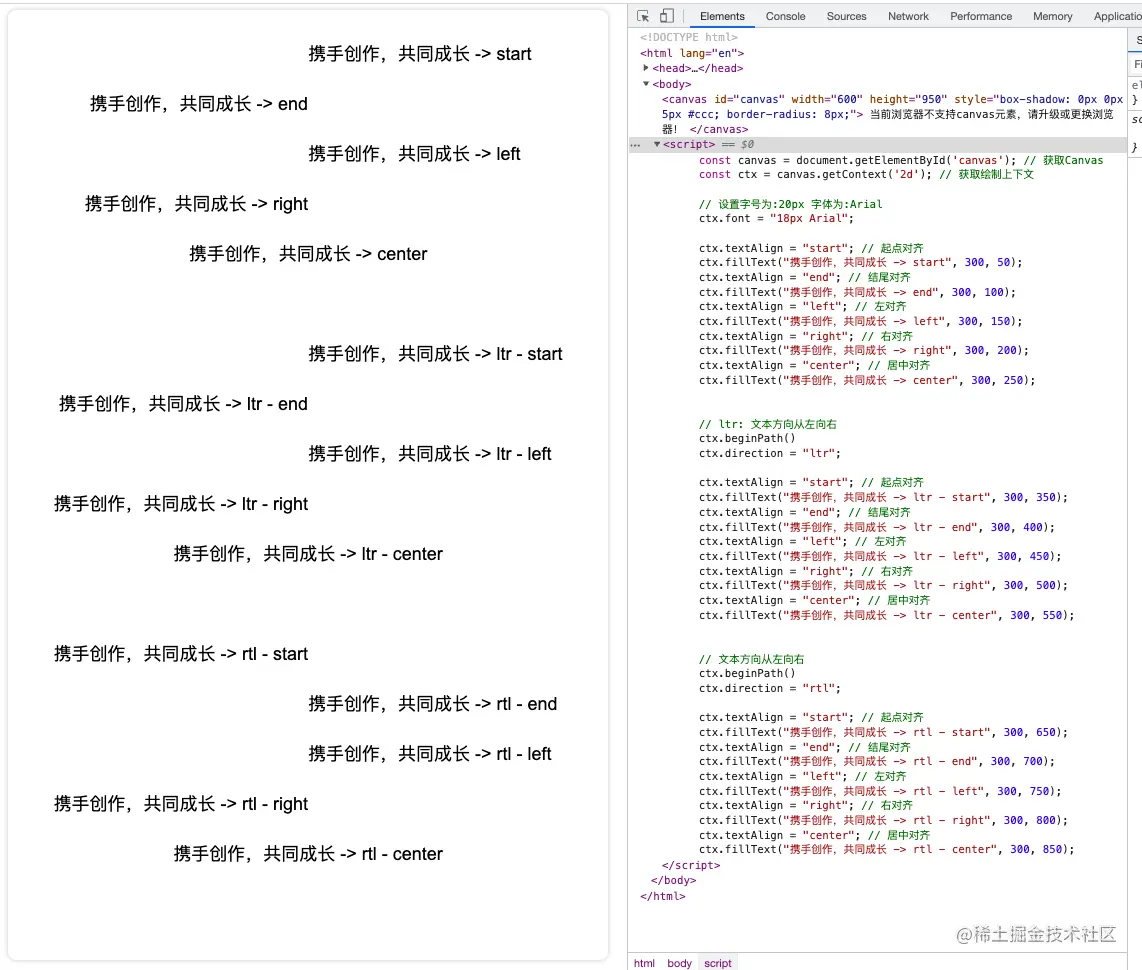
对齐方式
textAlign属性的设置可以改变文本对齐的方式。默认值是 start,可选值有:left、right、center、start和end。
文字方向
direction属性可以设置文本的方向。默认值是 inherit, 可选值为:ltr(文本方向从左向右)、rtl(文本方向从右向左)、inherit(根据情况继承 Canvas元素或者 Document 。)。
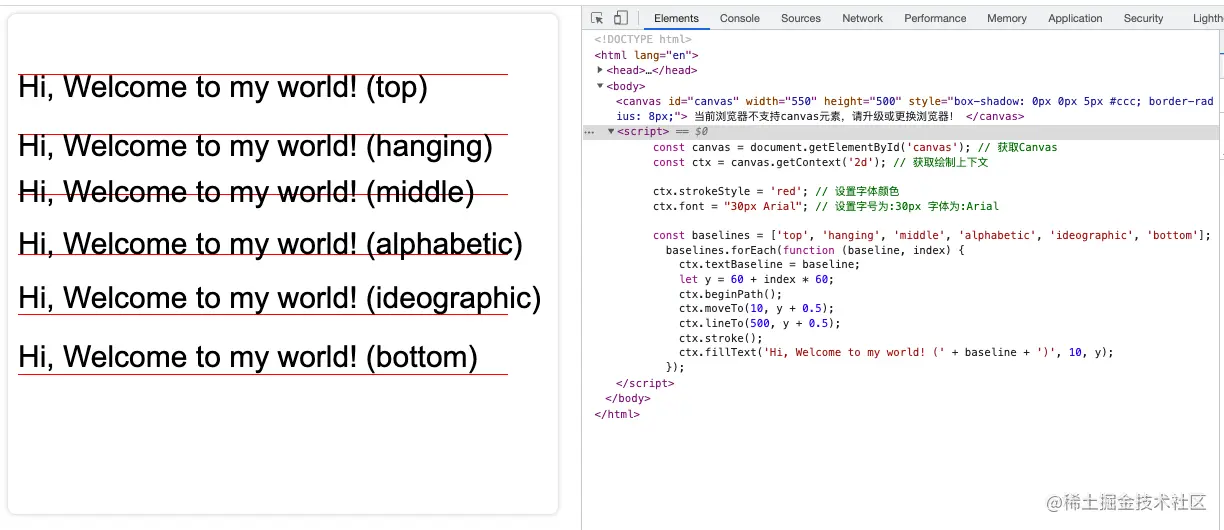
基线对齐
textBaseline属性设置基于基线对齐的文字垂直方向的对齐方式。默认值是alphabetic,可选值为:top、hanging、middle、alphabetic、ideographic和bottom。
阴影
shadowOffsetX
shadowOffsetX属性用于设置阴影在 X轴 上的延伸距离,默认值为0,如设置为10,则表示延 X轴 向右延伸10像素的阴影,也可以为负值,负值表示阴影会往反方向(向左)延伸。
shadowOffsetY
shadowOffsetY属性用于设置阴影在 Y轴 上的延伸距离,默认值为0,如设置为10,则表示延 Y轴 向下延伸10像素的阴影,也可以为负值,负值表示阴影会往反方向(向上)延伸。
shadowBlur
shadowBlur属性用于设置阴影的模糊程度,默认为 0。
shadowColor
shadowColor属性用于设置阴影的颜色,默认为全透明的黑色。
绘制图像
drawImage,并且 drawImage方法会根据不同的传参实现不同的功能:绘制图像、缩放图像、裁剪图像。
语法:
1
| drawImage(image, sx, sy, sWidth, sHeight, dx, dy, dWidth, dHeight)
|
参数:
- image:绘制的元素(图像)。
- sx、sy:裁剪框左上角的坐标。
- sWidth、sHeight:裁剪框的宽度和高度。
- dx、dy:绘制元素(图像)时左上角的坐标。
- dWidth、dHeight:绘制元素(图像)的宽度和高度。如果不设置,则在绘制时image宽度和高度不会缩放。
1
2
3
4
5
6
7
8
| const canvas = document.getElementById('canvas');
const ctx = canvas.getContext('2d');
var img = new Image();
img.src = 'https://p9-juejin.byteimg.com/tos-cn-i-k3u1fbpfcp/9f56ebb2a6674e1fbd55a3d92df042bd~tplv-k3u1fbpfcp-watermark.image';
img.onload = function(){
ctx.drawImage(img, 0, 150, 1650, 700, 0, 0, 550, 500);
}
|
动画
移动
移动就是把元素从一个地方移动到另外一个地方。
语法:translate(x, y),其中 x 是左右偏移量,y 是上下偏移量。
旋转
了解了移动以后,旋转也比较好理解,就是把元素顺时针旋转一定的弧度。
语法:rotate(angle),其中 angle 是旋转的角度,以弧度为单位,顺时针旋转。
1
2
3
4
5
6
7
8
9
| const canvas = document.getElementById('canvas');
const ctx = canvas.getContext('2d');
for (let i = 0; i < 9; i++) {
ctx.fillStyle=`#${i}${i}${i}`
ctx.rotate(i * 2 * Math.PI / 180);
ctx.fillRect(100, 0, 200, 100)
}
|
缩放
了解了移动和旋转以后,缩放也就更好理解了,就是把元素按一定的比例整体缩小或放大。
语法:scale(x, y),其中 x 为水平缩放的值,y 为垂直缩放得值。x和y的值小于1则为缩小,大于1则为放大。默认值为 1。
状态的保存和恢复
状态的保存和恢复 用到的方法是 save() 和 restore(), 分别是保存和恢复。方法不需要参数,直接调用就OK。
绘画的状态有哪些呢(就是我们可以保存和恢复的状态有哪些)?我们列举一下:
- 应用的变形:移动、旋转、缩放、strokeStyle、fillStyle、globalAlpha、lineWidth、lineCap、lineJoin、miterLimit、lineDashOffset、shadowOffsetX、shadowOffsetY、shadowBlur、shadowColor、globalCompositeOperation、font、textAlign、textBaseline、direction、imageSmoothingEnabled等。
- 应用的裁切路径(clipping path)
正式动画
Canvas呈现的东西都是绘制完了以后才能看到,因此想通过Canvas自己提供的Api来实现动画是做不到的。
那么想在 Canvas 中实现动画就得借助别的东西,那么借助啥呢?
在我们的 windows 对象上有三个方法:
- setInterval(function, delay) :定时器,当设定好间隔时间后,function 会定期执行。
- setTimeout(function, delay):延时器,在设定好的时间之后执行函数
- requestAnimationFrame(callback):告诉浏览器你希望执行一个动画,并在重绘之前,请求浏览器执行一个特定的函数来更新动画。
1
2
3
4
5
6
7
8
9
10
11
12
13
14
15
16
17
18
19
20
21
22
23
24
25
26
27
28
29
30
31
32
33
34
35
36
37
38
39
40
41
42
43
|
const canvas = document.getElementById('canvas');
const ctx = canvas.getContext('2d');
ctx.globalCompositeOperation = 'destination-over';
const width = canvas.width
const height = canvas.height
let num = 0
ctx.strokeStyle = "#ccc"
const img = new Image()
img.src="../images/plane.png"
img.onload = ()=>{
requestAnimationFrame(planeRun);
}
function planeRun(){
ctx.clearRect(0, 0, width, height)
ctx.save();
ctx.translate(250, 250);
num += 0.01
ctx.rotate(-num);
ctx.translate(0, 200);
ctx.drawImage(img, -20, -25, 40, 40);
ctx.restore();
ctx.beginPath();
ctx.arc(250, 250, 200, 0, Math.PI * 2, false);
ctx.stroke();
requestAnimationFrame(planeRun);
}
|
画布清空
在我们的Canvas中其实它本身已经提供了这样的方法:clearRect()
语法:clearRect(x, y, width, height)
参数:
- x为要清除的矩形区域左上角的x坐标,
- y为要清除的矩形区域左上角的y坐标
- width为要清除的矩形区域的宽度
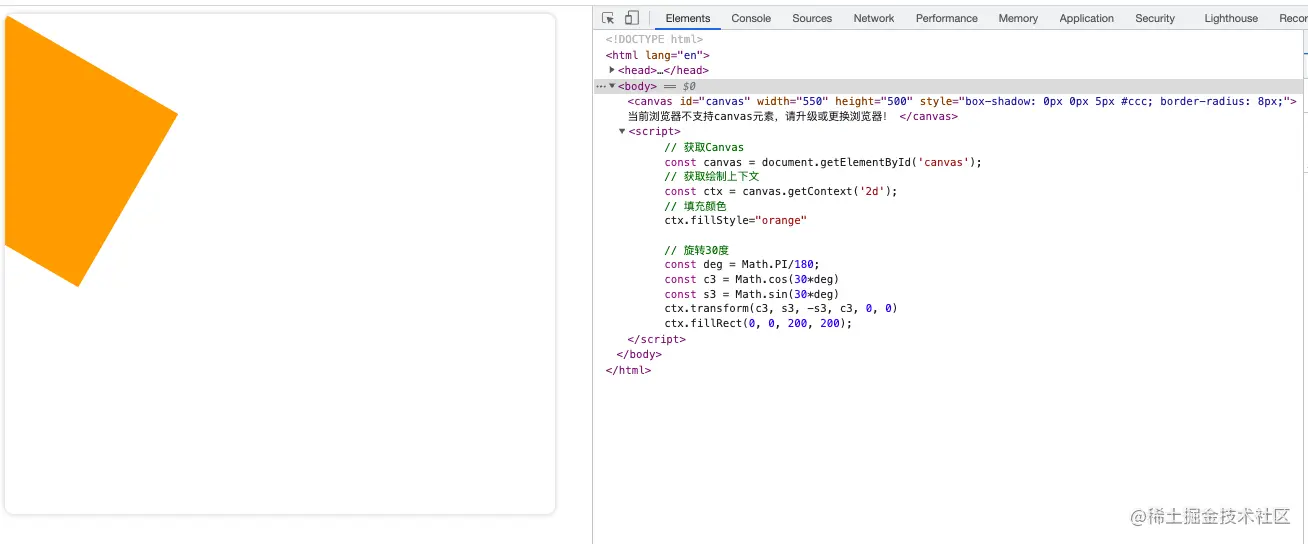
transform不仅能实现移动、旋转和缩放,还能实现斜切。
语法:
transform(a, b, c, d, e, f),
参数:
- a:水平缩放,不缩放为1
- b:水平倾斜,不倾斜为0
- c:垂直倾斜,不倾斜为0
- d:垂直缩放,不缩放为1
- e:水平移动,不移动为0
- f:垂直移动,不移动为0
因此不设置参数的时候,默认参数为`transform(1, 0, 0, 1, 0, 0)
旋转
1
2
3
4
5
6
7
8
9
10
11
12
13
|
const canvas = document.getElementById('canvas');
const ctx = canvas.getContext('2d');
ctx.fillStyle="orange"
const deg = Math.PI/180;
const c3 = Math.cos(30*deg)
const s3 = Math.sin(30*deg)
ctx.transform(c3, s3, -s3, c3, 0, 0)
ctx.fillRect(0, 0, 200, 200);
|
鼠标事件
click(点击)
dblclick(双击)
mouseover(鼠标移入)支持事件冒泡
mouseout(鼠标移出)支持事件冒泡
mouseenter(鼠标移入)不支持事件冒泡
mouseleave(鼠标移出)不支持事件冒泡
mousedown(鼠标按下)
mouseup(鼠标抬起)
mousemove(鼠标移动)
mousewheel(鼠标滚轮)
键盘事件
- keydown(键盘按下)
- keyup(键盘抬起)
- keypress(键盘按下)
事件的添加和移除
给Canvas中的元素添加事件我们用的是:addEventListener()方法,移除事件用的是removeEventListener()方法,也可以通过window添加监测canvas
内部元素添加事件
转至pixi.js
图片保存
所需方法
toDataURL
toDataURL()方法可以返回一个包含图片的Data URL。
Data URL也就是前缀为 data: 协议的URL,其允许内容创建者向文档中嵌入小文件。
语法:
toDataURL(type, encoderOptions)
参数:
- type:
type为图片格式,默认为image/png,也可指定为:image/jpeg、image/webp等格式
- encoderOptions:
encoderOptions为图片的质量,默认值 0.92。在指定图片格式为 image/jpeg 或 image/webp 的情况下,可以从 0 到 1 的区间内选择图片的质量。如果不在这个范围内,则使用默认值 0.92。
1
2
3
4
5
6
7
8
9
10
11
12
13
14
15
16
17
18
19
20
21
22
23
24
25
26
27
|
function clickFn(){
let url = canvas.toDataURL("image/png");
Img.src = url;
let arr = url.split(",")
let mime = arr[0].match(/:(.*?);/)[1]
let bstr = atob(arr[1])
let n = bstr.length
let u8arr = new Uint8Array(n);
while (n--) {
u8arr[n] = bstr.charCodeAt(n);
}
let file = new File([u8arr], "filename", { type: mime });
let aDom = document.createElement("a");
aDom.download = file.name;
let href = URL.createObjectURL(file);
aDom.href = href;
document.body.appendChild(aDom);
aDom.click();
document.body.removeChild(aDom);
URL.revokeObjectURL(href);
};
|
滤镜
所需方法
getImageData()
getImageData()方法可以返回一个ImageData对象。
1
| ImageData`对象用来描述`canvas`区域隐含的像素数据,此区域通过矩形表示,起始点为`(sx, sy)`、宽为`sw`、高为`sh
|
语法:
getImageData(sx, sy, sw, sh)
参数:
- sx:将要被提取的图像数据矩形区域的左上角 x 坐标。
- sy:将要被提取的图像数据矩形区域的左上角 y 坐标。
- sw:将要被提取的图像数据矩形区域的宽度。
- sh:将要被提取的图像数据矩形区域的高度。
putImageData()
putImageData()方法和getImageData()方法正好相反,可以将数据从已有的ImageData对象绘制为位图。如果提供了一个绘制过的矩形,则只绘制该矩形的像素。
语法:
putImageData(imagedata, dx, dy, dirtyX, dirtyY, dirtyWidth, dirtyHeight)
参数:
- ImageData:包含像素值的数组对象。
- dx:源图像数据在目标画布中 x 轴方向的偏移量。
- dy:源图像数据在目标画布中 y 轴方向的偏移量。
- dirtyX:可选参数,在源图像数据中,矩形区域左上角的位置。默认是整个图像数据的左上角(x 坐标)。
- dirtyY:可选参数,在源图像数据中,矩形区域左上角的位置。默认是整个图像数据的左上角(y 坐标)。
- dirtyWidth:可选参数,在源图像数据中,矩形区域的宽度。默认是图像数据的宽度。
- dirtyHeight:可选参数,在源图像数据中,矩形区域的高度。默认是图像数据的高度。
知道了这两个方法以后,下面我们简单编写两个方法来做两个主题(滤镜)效果。
黑白主题
blackWhite函数来实现,具体是减掉颜色的最大色值255来实现
1
2
3
4
5
6
7
8
9
10
11
12
| const blackWhite = function() {
ctx.drawImage(img, 0, 0, 450, 800);
const imageData = ctx.getImageData(0, 0, canvas.width, canvas.height);
const data = imageData.data;
for (var i = 0; i < data.length; i += 4) {
var avg = (data[i] + data[i + 1] + data[i + 2]) / 3;
data[i] = avg;
data[i + 1] = avg;
data[i + 2] = avg;
}
ctx.putImageData(imageData, 0, 0);
};
|
曝光主题
黑白主题咱们用一个:blackWhite函数来实现,具体是减掉颜色的最大色值255来实现
1
2
3
4
5
6
7
8
9
10
11
| const exposure = function() {
ctx.drawImage(img, 0, 0, 450, 800);
const imageData = ctx.getImageData(0, 0, canvas.width, canvas.height);
const data = imageData.data;
for (var i = 0; i < data.length; i += 4) {
data[i] = 255 - data[i];
data[i + 1] = 255 - data[i + 1];
data[i + 2] = 255 - data[i + 2];
}
ctx.putImageData(imageData, 0, 0);
};
|
拾色器
使用getImageData()
1
2
3
4
5
6
7
8
9
10
11
12
13
14
15
16
17
18
19
20
21
22
23
24
25
26
27
28
29
30
31
32
33
34
35
36
37
38
|
var canvas = document.getElementById('canvas');
if(canvas.getContext) {
var ctx = canvas.getContext('2d');
var img = new Image();
img.crossOrigin = 'anonymous';
img.src = 'https://img1.baidu.com/it/u=4141276181,3458238270&fm=253&fmt=auto&app=138&f=JPEG';
img.onload = function() {
ctx.drawImage(img, 0, 0, 450, 800);
img.style.display = 'none';
};
var hoveredColor = document.getElementById('hovered');
var selectedColor = document.getElementById('selected');
canvas.addEventListener('mousemove', function(event) {
pickColor('move', event, hoveredColor);
});
canvas.addEventListener('click', function(event) {
pickColor('click', event, selectedColor);
});
function pickColor(type, event, destination) {
var x = event.layerX;
var y = event.layerY;
var pixel = ctx.getImageData(x, y, 1, 1);
var data = pixel.data;
const rgba = `rgba(${data[0]}, ${data[1]}, ${data[2]}, ${data[3] / 255})`;
destination.style.background = rgba;
if(type === 'move') {
destination.textContent = "划过的颜色为:" + rgba;
} else {
destination.textContent = "选中的颜色为:" + rgba;
}
return rgba;
}
}
|
签名
canvas.addEventListener
1
2
3
4
5
6
7
8
9
10
11
12
13
14
15
16
17
18
19
20
21
22
23
24
25
26
27
28
29
30
31
32
33
34
35
36
37
38
39
40
41
42
43
44
45
46
47
48
49
50
51
52
53
| <!DOCTYPE html>
<html lang="en">
<head>
<meta charset="UTF-8">
<meta http-equiv="X-UA-Compatible" content="IE=edge">
<meta name="viewport" content="width=device-width, initial-scale=1.0">
<title>canvas - 签名</title>
<style>
canvas {
box-shadow: 0px 0px 5px #ccc;
border-radius: 8px;
}
div {
width: 450px;
box-shadow: 0px 0px 5px #ccc;
border-radius: 8px;
text-align: center;
}
</style>
</head>
<body>
<canvas id="canvas" width="450" height="300">
当前浏览器不支持canvas元素,请升级或更换浏览器!
</canvas>
<div id="clear">清空画布</div>
<script>
var canvas = document.getElementById('canvas');
var clear = document.getElementById('clear');
const ctx = canvas.getContext("2d");
canvas.addEventListener('mouseenter', () => {
canvas.addEventListener('mousedown', (e) => {
ctx.beginPath()
ctx.moveTo(e.offsetX, e.offsetY)
canvas.addEventListener('mousemove', draw)
})
canvas.addEventListener('mouseup', () => {
canvas.removeEventListener('mousemove', draw)
})
})
function draw(e) {
ctx.lineTo(e.offsetX, e.offsetY)
ctx.stroke()
}
clear.addEventListener('click', () => {
ctx.clearRect(0, 0, canvas.width, canvas.height);
})
</script>
</body>
</html>
|
刮刮奖
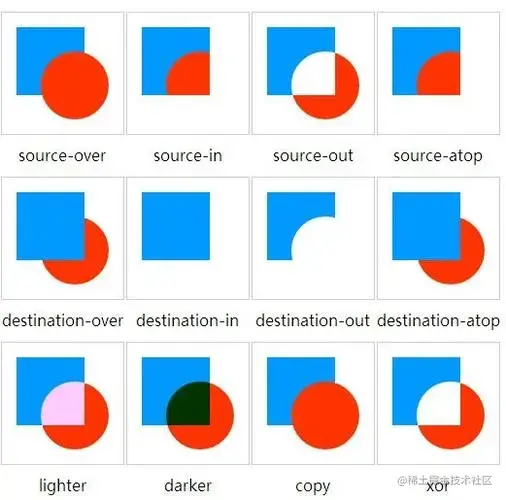
使用globalCompositeOperation
语法:globalCompositeOperation = type,属性值 type 表示是要使用的合成或混合模式操作的类型。
type属性为不同值时,绘制显示将会不同,具体的类型值我们列一下:
| 属性类型 |
表现形式 |
| source-over |
默认。在目标图像上显示源图像 |
| source-atop |
在目标图像顶部显示源图像。源图像位于目标图像之外的部分是不可见的。 |
| source-in |
在目标图像中显示源图像。只有目标图像内的源图像部分会显示,目标图像是透明的。 |
| source-out |
在目标图像之外显示源图像。只会显示目标图像之外源图像部分,目标图像是透明的。 |
| destination-over |
在源图像上方显示目标图像。 |
| destination-atop |
在源图像顶部显示目标图像。源图像之外的目标图像部分不会被显示。 |
| destination-in |
在源图像中显示目标图像。只有源图像内的目标图像部分会被显示,源图像是透明的。 |
| destination-out |
在源图像外显示目标图像。只有源图像外的目标图像部分会被显示,源图像是透明的。 |
| lighter |
显示源图像 + 目标图像。 |
| copy |
显示源图像。忽略目标图像。 |
| xor |
使用异或操作对源图像与目标图像进行组合。 |
擦玻璃
使用高斯模糊
1
2
3
4
5
6
7
8
9
10
11
12
13
14
15
16
17
18
19
20
21
22
23
24
25
26
27
28
29
30
31
32
33
34
35
36
37
38
39
40
41
42
43
44
45
46
47
48
49
50
51
52
53
54
55
56
57
58
59
60
61
62
63
64
65
66
67
68
69
70
71
72
73
74
75
76
77
78
79
80
81
82
83
84
85
86
87
88
89
90
91
92
93
94
95
96
97
98
99
100
101
102
103
104
105
106
107
108
109
110
111
112
113
114
115
116
117
118
119
120
121
122
123
124
125
126
127
128
129
130
131
132
133
134
135
136
137
138
139
140
141
142
143
144
145
146
147
148
149
150
151
152
153
154
155
156
157
158
159
160
161
162
163
164
165
166
167
168
169
170
171
172
173
174
175
176
177
178
179
180
181
182
183
184
185
186
187
188
189
190
| <!DOCTYPE html>
<html lang="en">
<head>
<meta charset="UTF-8">
<meta http-equiv="X-UA-Compatible" content="IE=edge">
<meta name="viewport" content="width=device-width, initial-scale=1.0">
<title>canvas - 刮刮奖</title>
<style>
canvas {
background-image: url("https://gimg2.baidu.com/image_search/src=http%3A%2F%2Ffile.moyublog.com%2Fd%2Ffile%2F2021-05-29%2Ff8b2a20556774afebed8fd91ccbe0497.jpg&refer=http%3A%2F%2Ffile.moyublog.com&app=2002&size=f9999,10000&q=a80&n=0&g=0n&fmt=auto?sec=1672406341&t=a0b71fded87dd696982c1632cc015397");
background-size: cover;
background-position: center;
box-shadow: 0px 0px 5px #ccc;
border-radius: 8px;
float: left;
}
</style>
</head>
<body>
<canvas id="canvas" width="1000" height="500">
当前浏览器不支持canvas元素,请升级或更换浏览器!
</canvas>
<script>
var canvas = document.getElementById('canvas');
if(canvas.getContext) {
var ctx = canvas.getContext('2d');
const imageUrl = "https://gimg2.baidu.com/image_search/src=http%3A%2F%2Ffile.moyublog.com%2Fd%2Ffile%2F2021-05-29%2Ff8b2a20556774afebed8fd91ccbe0497.jpg&refer=http%3A%2F%2Ffile.moyublog.com&app=2002&size=f9999,10000&q=a80&n=0&g=0n&fmt=auto?sec=1672406341&t=a0b71fded87dd696982c1632cc015397";
ctx.lineCap = 'round'
ctx.lineJoin = 'round'
ctx.lineWidth = 50
canvas.addEventListener("mousedown", mousedownFn, false)
let downX,downY
function mousedownFn(e) {
e.preventDefault()
downX = e.pageX
downY = e.pageY
drawLine({startX: downX, startY: downY})
canvas.addEventListener("mousemove", mousemoveFn, false)
canvas.addEventListener("mouseup", mouseupFn, false)
}
function mousemoveFn(e) {
e.preventDefault()
const moveX = e.pageX
const moveY = e.pageY
drawLine({endX: moveX, endY: moveY})
downX = moveX
downY = moveY
}
function mouseupFn() {
canvas.removeEventListener("mousemove", mousemoveFn, false)
canvas.removeEventListener("mouseup", mouseupFn, false)
}
function drawLine(position) {
const { startX, startY, endX, endY } = position
ctx.beginPath()
ctx.moveTo(startX, startY)
ctx.lineTo(endX || startX, endY || startY)
ctx.stroke()
}
drawImage(imageUrl)
function drawImage(src) {
const img = new Image()
img.crossOrigin = ''
img.src = src
img.onload = () => {
const imageAspectRatio = img.width / img.height
const canvasAspectRatio = canvas.width / canvas.height
ctx.drawImage( img, 0, 0, canvas.width, canvas.height )
var canvasData = ctx.getImageData(0, 0, canvas.width, canvas.height);
var tempData = gaussBlur(canvasData, 20);
ctx.putImageData(tempData,0,0);
ctx.globalCompositeOperation = 'destination-out'
}
}
function gaussBlur(imgData) {
const pixes = imgData.data;
const width = imgData.width;
const height = imgData.height;
const gaussMatrix = [];
let gaussSum = 0;
let x;
let y;
let r;
let g;
let b;
let a;
let i;
let j;
let k;
let len;
const radius = 10;
const sigma = 20;
a = 1 / (Math.sqrt(2 * Math.PI) * sigma);
b = -1 / (2 * sigma * sigma);
for (i = 0, x = -radius; x <= radius; x++, i++) {
g = a * Math.exp(b * x * x);
gaussMatrix[i] = g;
gaussSum += g;
}
for (i = 0, len = gaussMatrix.length; i < len; i++) {
gaussMatrix[i] /= gaussSum;
}
for (y = 0; y < height; y++) {
for (x = 0; x < width; x++) {
r = g = b = a = 0;
gaussSum = 0;
for (j = -radius; j <= radius; j++) {
k = x + j;
if (k >= 0 && k < width) {
i = (y * width + k) * 4;
r += pixes[i] * gaussMatrix[j + radius];
g += pixes[i + 1] * gaussMatrix[j + radius];
b += pixes[i + 2] * gaussMatrix[j + radius];
gaussSum += gaussMatrix[j + radius];
}
}
i = (y * width + x) * 4;
pixes[i] = r / gaussSum;
pixes[i + 1] = g / gaussSum;
pixes[i + 2] = b / gaussSum;
}
}
for (x = 0; x < width; x++) {
for (y = 0; y < height; y++) {
r = g = b = a = 0;
gaussSum = 0;
for (j = -radius; j <= radius; j++) {
k = y + j;
if (k >= 0 && k < height) {
i = (k * width + x) * 4;
r += pixes[i] * gaussMatrix[j + radius];
g += pixes[i + 1] * gaussMatrix[j + radius];
b += pixes[i + 2] * gaussMatrix[j + radius];
gaussSum += gaussMatrix[j + radius];
}
}
i = (y * width + x) * 4;
pixes[i] = r / gaussSum;
pixes[i + 1] = g / gaussSum;
pixes[i + 2] = b / gaussSum;
}
}
return imgData
}
}
</script>
</body>
</html>
|